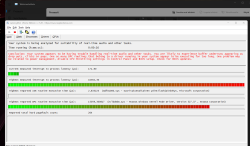
Nojoo tuli vähän hätiköityä, että olisi ratkennut. Eipä tosiaan ollut siitä johtuva. Liitteenä tuo latencymonian yhteenveto
_________________________________________________________________________________________________________
CONCLUSION
_________________________________________________________________________________________________________
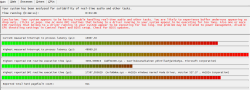
Your system appears to be having trouble handling real-time audio and other tasks. You are likely to experience buffer underruns appearing as drop outs, clicks or pops. One or more DPC routines that belong to a driver running in your system appear to be executing for too long. Also one or more ISR routines that belong to a driver running in your system appear to be executing for too long. One problem may be related to power management, disable CPU throttling settings in Control Panel and BIOS setup. Check for BIOS updates.
LatencyMon has been analyzing your system for 0:01:48 (h:mm:ss) on all processors.
_________________________________________________________________________________________________________
SYSTEM INFORMATION
_________________________________________________________________________________________________________
Computer name: DESKTOP-07THANS
OS version: Windows 11, 10.0, version 2009, build: 22621 (x64)
Hardware: OMEN by HP 45L Gaming Desktop GT22-0xxx, HP
BIOS: F.14
CPU: AuthenticAMD AMD Ryzen 7 5800X 8-Core Processor
Logical processors: 16
Processor groups: 1
Processor group size: 16
RAM: 32424 MB total
_________________________________________________________________________________________________________
CPU SPEED
_________________________________________________________________________________________________________
Reported CPU speed (WMI): 3801 MHz
Reported CPU speed (registry): 3793 MHz
Note: reported execution times may be calculated based on a fixed reported CPU speed. Disable variable speed settings like Intel Speed Step and AMD Cool N Quiet in the BIOS setup for more accurate results.
_________________________________________________________________________________________________________
MEASURED INTERRUPT TO USER PROCESS LATENCIES
_________________________________________________________________________________________________________
The interrupt to process latency reflects the measured interval that a usermode process needed to respond to a hardware request from the moment the interrupt service routine started execution. This includes the scheduling and execution of a DPC routine, the signaling of an event and the waking up of a usermode thread from an idle wait state in response to that event.
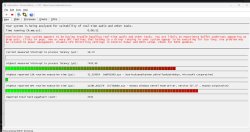
Highest measured interrupt to process latency (µs): 48060,10
Average measured interrupt to process latency (µs): 1394,395837
Highest measured interrupt to DPC latency (µs): 48054,40
Average measured interrupt to DPC latency (µs): 1387,730005
_________________________________________________________________________________________________________
REPORTED ISRs
_________________________________________________________________________________________________________
Interrupt service routines are routines installed by the OS and device drivers that execute in response to a hardware interrupt signal.
Highest ISR routine execution time (µs): 3093,698919
Driver with highest ISR routine execution time: Wdf01000.sys - Suorituksenaikainen ydintilaohjainkehys, Microsoft Corporation
Highest reported total ISR routine time (%): 0,001309
Driver with highest ISR total time: Wdf01000.sys - Suorituksenaikainen ydintilaohjainkehys, Microsoft Corporation
Total time spent in ISRs (%) 0,001309
ISR count (execution time <250 µs): 18002
ISR count (execution time 250-500 µs): 0
ISR count (execution time 500-1000 µs): 0
ISR count (execution time 1000-2000 µs): 2
ISR count (execution time 2000-4000 µs): 4
ISR count (execution time >=4000 µs): 0
_________________________________________________________________________________________________________
REPORTED DPCs
_________________________________________________________________________________________________________
DPC routines are part of the interrupt servicing dispatch mechanism and disable the possibility for a process to utilize the CPU while it is interrupted until the DPC has finished execution.
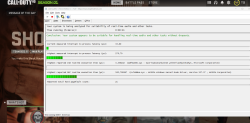
Highest DPC routine execution time (µs): 17597,055629
Driver with highest DPC routine execution time: nvlddmkm.sys - NVIDIA Windows Kernel Mode Driver, Version 527.37 , NVIDIA Corporation
Highest reported total DPC routine time (%): 0,747084
Driver with highest DPC total execution time: nvlddmkm.sys - NVIDIA Windows Kernel Mode Driver, Version 527.37 , NVIDIA Corporation
Total time spent in DPCs (%) 0,797440
DPC count (execution time <250 µs): 102780
DPC count (execution time 250-500 µs): 0
DPC count (execution time 500-10000 µs): 230
DPC count (execution time 1000-2000 µs): 687
DPC count (execution time 2000-4000 µs): 2515
DPC count (execution time >=4000 µs): 754
_________________________________________________________________________________________________________
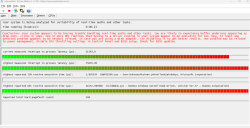
REPORTED HARD PAGEFAULTS
_________________________________________________________________________________________________________
Hard pagefaults are events that get triggered by making use of virtual memory that is not resident in RAM but backed by a memory mapped file on disk. The process of resolving the hard pagefault requires reading in the memory from disk while the process is interrupted and blocked from execution.
NOTE: some processes were hit by hard pagefaults. If these were programs producing audio, they are likely to interrupt the audio stream resulting in dropouts, clicks and pops. Check the Processes tab to see which programs were hit.
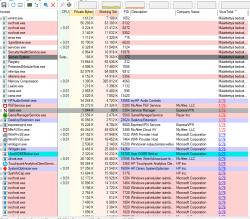
Process with highest pagefault count: mfeavsvc.exe
Total number of hard pagefaults 611
Hard pagefault count of hardest hit process: 267
Number of processes hit: 14
_________________________________________________________________________________________________________
PER CPU DATA
_________________________________________________________________________________________________________
CPU 0 Interrupt cycle time (s): 79,921923
CPU 0 ISR highest execution time (µs): 3093,698919
CPU 0 ISR total execution time (s): 0,022660
CPU 0 ISR count: 18008
CPU 0 DPC highest execution time (µs): 17597,055629
CPU 0 DPC total execution time (s): 13,576838
CPU 0 DPC count: 46876
_________________________________________________________________________________________________________
CPU 1 Interrupt cycle time (s): 0,603133
CPU 1 ISR highest execution time (µs): 0,0
CPU 1 ISR total execution time (s): 0,0
CPU 1 ISR count: 0
CPU 1 DPC highest execution time (µs): 63,426839
CPU 1 DPC total execution time (s): 0,000268
CPU 1 DPC count: 72
_________________________________________________________________________________________________________
CPU 2 Interrupt cycle time (s): 2,707094
CPU 2 ISR highest execution time (µs): 0,0
CPU 2 ISR total execution time (s): 0,0
CPU 2 ISR count: 0
CPU 2 DPC highest execution time (µs): 605,655682
CPU 2 DPC total execution time (s): 0,005788
CPU 2 DPC count: 855
_________________________________________________________________________________________________________
CPU 3 Interrupt cycle time (s): 2,338170
CPU 3 ISR highest execution time (µs): 0,0
CPU 3 ISR total execution time (s): 0,0
CPU 3 ISR count: 0
CPU 3 DPC highest execution time (µs): 149,144740
CPU 3 DPC total execution time (s): 0,001275
CPU 3 DPC count: 297
_________________________________________________________________________________________________________
CPU 4 Interrupt cycle time (s): 2,787268
CPU 4 ISR highest execution time (µs): 0,0
CPU 4 ISR total execution time (s): 0,0
CPU 4 ISR count: 0
CPU 4 DPC highest execution time (µs): 23,092539
CPU 4 DPC total execution time (s): 0,001157
CPU 4 DPC count: 317
_________________________________________________________________________________________________________
CPU 5 Interrupt cycle time (s): 2,705432
CPU 5 ISR highest execution time (µs): 0,0
CPU 5 ISR total execution time (s): 0,0
CPU 5 ISR count: 0
CPU 5 DPC highest execution time (µs): 32,018982
CPU 5 DPC total execution time (s): 0,000567
CPU 5 DPC count: 174
_________________________________________________________________________________________________________
CPU 6 Interrupt cycle time (s): 2,582485
CPU 6 ISR highest execution time (µs): 0,0
CPU 6 ISR total execution time (s): 0,0
CPU 6 ISR count: 0
CPU 6 DPC highest execution time (µs): 195,860796
CPU 6 DPC total execution time (s): 0,007121
CPU 6 DPC count: 1316
_________________________________________________________________________________________________________
CPU 7 Interrupt cycle time (s): 1,906407
CPU 7 ISR highest execution time (µs): 0,0
CPU 7 ISR total execution time (s): 0,0
CPU 7 ISR count: 0
CPU 7 DPC highest execution time (µs): 207,011337
CPU 7 DPC total execution time (s): 0,002704
CPU 7 DPC count: 683
_________________________________________________________________________________________________________
CPU 8 Interrupt cycle time (s): 2,650294
CPU 8 ISR highest execution time (µs): 0,0
CPU 8 ISR total execution time (s): 0,0
CPU 8 ISR count: 0
CPU 8 DPC highest execution time (µs): 5238,089112
CPU 8 DPC total execution time (s): 0,019859
CPU 8 DPC count: 2771
_________________________________________________________________________________________________________
CPU 9 Interrupt cycle time (s): 1,535392
CPU 9 ISR highest execution time (µs): 0,0
CPU 9 ISR total execution time (s): 0,0
CPU 9 ISR count: 0
CPU 9 DPC highest execution time (µs): 336,309518
CPU 9 DPC total execution time (s): 0,005283
CPU 9 DPC count: 1145
_________________________________________________________________________________________________________
CPU 10 Interrupt cycle time (s): 2,133848
CPU 10 ISR highest execution time (µs): 0,0
CPU 10 ISR total execution time (s): 0,0
CPU 10 ISR count: 0
CPU 10 DPC highest execution time (µs): 200,880042
CPU 10 DPC total execution time (s): 0,012533
CPU 10 DPC count: 2699
_________________________________________________________________________________________________________
CPU 11 Interrupt cycle time (s): 2,365394
CPU 11 ISR highest execution time (µs): 0,0
CPU 11 ISR total execution time (s): 0,0
CPU 11 ISR count: 0
CPU 11 DPC highest execution time (µs): 1227,250725
CPU 11 DPC total execution time (s): 0,167329
CPU 11 DPC count: 48724
_________________________________________________________________________________________________________
CPU 12 Interrupt cycle time (s): 2,561526
CPU 12 ISR highest execution time (µs): 0,0
CPU 12 ISR total execution time (s): 0,0
CPU 12 ISR count: 0
CPU 12 DPC highest execution time (µs): 66,342209
CPU 12 DPC total execution time (s): 0,001049
CPU 12 DPC count: 230
_________________________________________________________________________________________________________
CPU 13 Interrupt cycle time (s): 2,485853
CPU 13 ISR highest execution time (µs): 0,0
CPU 13 ISR total execution time (s): 0,0
CPU 13 ISR count: 0
CPU 13 DPC highest execution time (µs): 10,128658
CPU 13 DPC total execution time (s): 0,000271
CPU 13 DPC count: 96
_________________________________________________________________________________________________________
CPU 14 Interrupt cycle time (s): 2,715709
CPU 14 ISR highest execution time (µs): 0,0
CPU 14 ISR total execution time (s): 0,0
CPU 14 ISR count: 0
CPU 14 DPC highest execution time (µs): 373,057211
CPU 14 DPC total execution time (s): 0,002704
CPU 14 DPC count: 470
_________________________________________________________________________________________________________
CPU 15 Interrupt cycle time (s): 2,558046
CPU 15 ISR highest execution time (µs): 0,0
CPU 15 ISR total execution time (s): 0,0
CPU 15 ISR count: 0
CPU 15 DPC highest execution time (µs): 39,051938
CPU 15 DPC total execution time (s): 0,000924
CPU 15 DPC count: 241
_________________________________________________________________________________________________________
")